


Article produced by WINGS.
The overall objective of IMPAQT is to develop and validate in-situ a multi-purpose (inland, coastal and offshore productions), multi-sensing (heterogeneous sensors and new/emerging technologies) and multi-functional (advanced monitoring, modelling, data analytics and decision making) management platform for sustainable Integrated Multi-Trophic Aquaculture (IMTA) production.
WINGS in IMPAQT develops novel data and predictive analytics (behavior monitoring, disease diagnosis, biomass estimation and forecasting, water quality monitoring) for supporting IMTA production, as well as optimal decision making and actuation with automation for optimising production systems, and the triggering of early warning alerts.
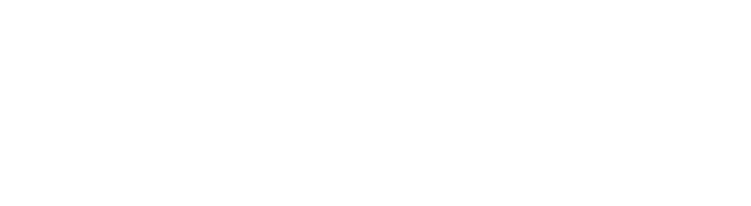
WINGS is also responsible for developing the IMPAQT IMS, a powerful Decision Support System (DSS) operating at the scale of an IMTA farm. This works online, and it is integrated with sensors, cameras, remote sensing (satellite data) and crowdsourcing apps. It comprises novel technologies (data and predictive analytics, decision making for alert notification and actuation) to enable improved operational decisions for animal welfare, production optimization, environmental protection, food quality and consequently sustainable productivity. IMPAQT IMS is deployed in six (6) pilots, in Scotland/UK, The Netherlands, Ireland, Turkey and China, covering inland, coastal and offshore production systems.
The IMPAQT IMS DSS covers the core business and operational needs of an IMTA farm, in the form of Decision Trees, addressing the following business cases:
- Optimal Feeding
- Optimal Harvesting and Seeding
- Optimal Grading
- Disease Prevention and Mitigation
- Overall Stock Welfare
- Breeding/Broodstock
- Environmental Footprint
Figure 1: IMS component architecture (developed by WINGS for IMPAQT IMS)
Indicatively, two business cases are analyzed hereafter.
A. Disease Prevention & Mitigation.
In this scenario, input data is collected by sensors or satellites (e.g. DO, Chl-a) and imported into the IMS. Additionally, operator reports and data collected from the IMS interface are recorded importing operational data (e.g. phytoplankton, jellyfish, parasite presence) to be also considered. Automatically calculated inputs are also taken into account, such as automatic observations from the disease diagnosis and behaviour analysis algorithms or formulas that are used for calculating parameters like the Stock Welfare Index (SWI). This data is exploited by the corresponding decision tree to notify the operator about the fish health and the prevention and mitigation actions proposed by site-specific protocols.
B. Stock Welfare
In this scenario, input data is collected by sensors or satellites (e.g. oxygen, ammonia, turbidity) and imported into the IMS. Additionally, operator reports and data collected from the IMS interface are recorded importing operational data (e.g., mortalities, feeding, infrastructure status, stress factors) to be considered as well. Automatically calculated inputs are also taken into account like automatic observations from the disease diagnosis and behaviour analysis algorithms or formulas that are used for calculating parameters like the FCR, biomass estimations, etc. This data is exploited by the corresponding decision tree to calculate the Stock Welfare Index (SWI).
Four analytics services are analyzed hereafter.
a. Disease diagnosis
Fish diseases are one of the factors that are always a concern for aquaculture producers. Outbreaks are to be avoided where possible, or when suitable, efficient treatment should be applied as rapidly as possible. The use of computer vision techniques can be helpful in improving diagnosis and treatment in the coming years.
The main target studied in this component is the identification of marks or scars in the fish body that may indicate a problem. This identification can give us a prediction in terms of possible disease. For this purpose, the IMS algorithms are analysed in 3 stages:
- Fish Detection
- Background Reduction
- Fish Disease Diagnosis
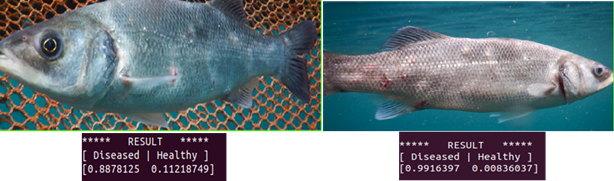
Figure 2: Fish disease diagnosis (developed by WINGS for IMPAQT IMS)
Fish disease diagnosis is the final component. The disease diagnosis algorithm is based on a Neural Network that uses as input an image, the result of the background reduction procedure. Provided that the input of the model is an image, the prediction is based on scars, marks, and any distortion in the fish body. The output of the algorithm is a prediction that represents the probability of infection in the fish, which can serve as an indication of a disease or problem, and alerts the producer to enable prevention. The algorithm’s output is also fused with input data from sensors or satellites (e.g. DO, Chl-a) and operator reports and data (e.g. phytoplankton, jellyfish, parasite presence), as discussed in the Disease Prevention & Mitigation business case before. This work is also extended to other species, like seaweed and shellfish.
b. Behaviour analysis
Behaviour represents a reaction to the environment and is a key element in fish welfare. Fish, and particularly farmed fish populations, are sensitive to stress factors that severely affect their health. Such stress factors can be stocking density, lack of feed, an attack by a predator, a recent storm, strong winds or currents.
Current advances in technologies, such as computer vision and predictive analytics, are used for improving the monitoring of fish welfare and the assessing of possible risk factors. Remote monitoring of fish populations using camera systems removes the additional stress factor of human presence in the environment and enables the constant and safe observation of fish.
The most important behavioural traits that affect fish welfare and are included in WINGS developments are:
- Fish swimming behaviour: this can be divided into individual and group swimming behaviour. In the first category, the behaviour is studied individually and can be organized in sustained, prolonged and burst swimming, while in the latter category it is studied as a school (group). Changes in swimming behaviour can be an indicator for feeding needs and the overall welfare of fish.
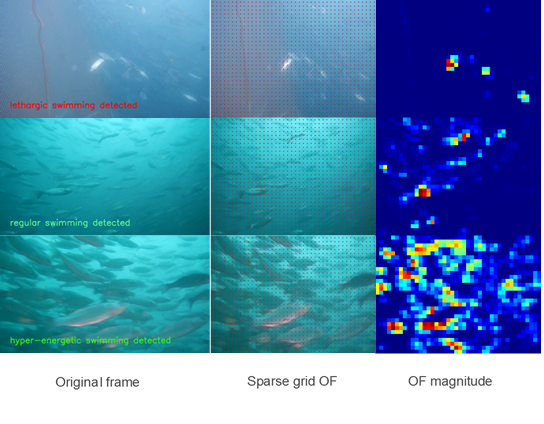
Figure 3: Group swimming behaviour tracking (developed by WINGS for IMPAQT IMS); a multilayer perceptron was trained in order to classify the group swimming behaviour in three classes: lethargic, regular, hyper-energetic behaviour
- Interaction with the environment: this includes the way fish interact with the nets of the cages, the water surface or the aquaculture equipment. Fish interaction with the nets, such as close inspection and biting, and abrupt surface jumps are indicators of their stress and willingness to escape. Preference or avoidance of an area in the cage also belong to this category.
- Social behaviour (schooling): this includes the way fish interact with other fish, competitiveness or aggression among them when territory or resources are limited, spatial characteristics such as fish distribution, homogeneity of swimming direction etc.
This work is also extended to other species, like seaweed and shellfish.
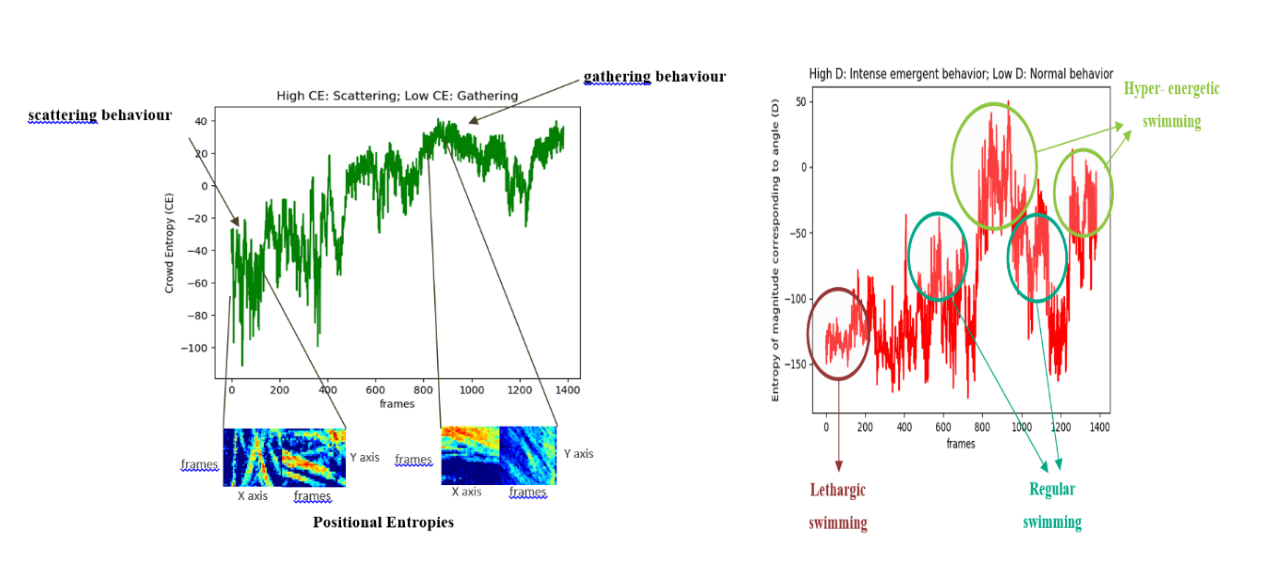
Figure 4: Entropies corresponding to the videos of swimming fish indicating whether fish are gathered or scattered (left) and their emergent behaviour (right) – (developed by WINGS for IMPAQT IMS)
c. Biomass estimation and forecasting
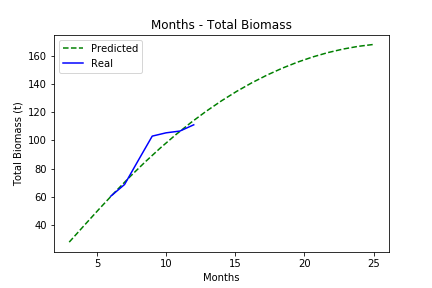
A fish detection algorithm is first implemented. After that, we calculate the fish length and then evaluate fish weight using fish length and length-weight functions. In addition, a biomass forecasting algorithm is developed to support fish harvesting in the appropriate time, saving money from extra feed, but also to check if the species growth is as anticipated. This work is also extended to other species, like seaweed and shellfish.
Figure 5: Total biomass per month, actual and predicted values from IMPAQT CAMLI pilot (developed by WINGS for IMPAQT IMS)
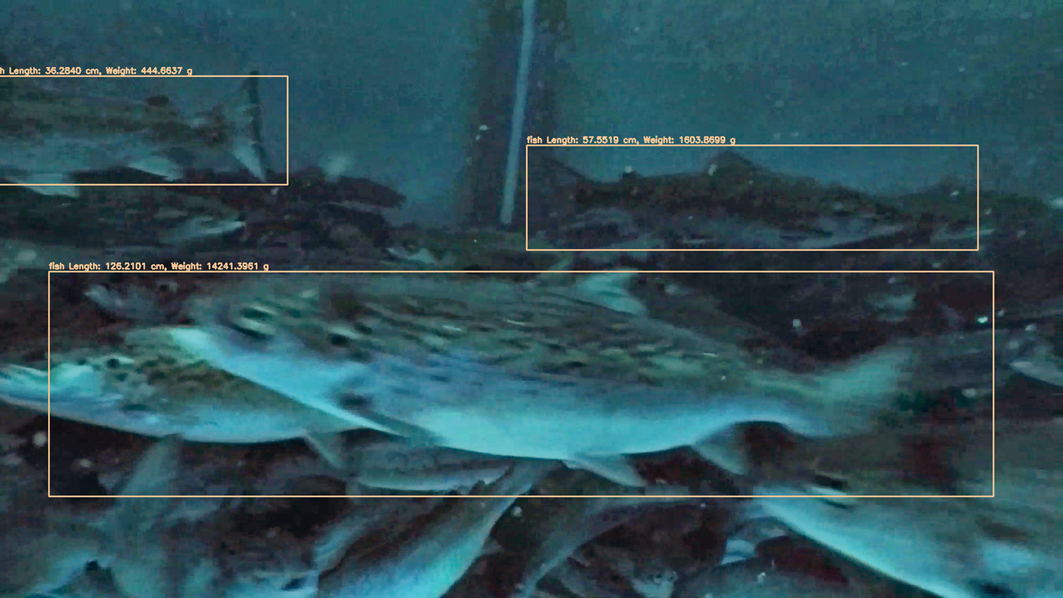
Figure 6: Biomass estimation (developed by WINGS for IMPAQT IMS)
d. Stock Welfare
The IMPAQT Stock Welfare Index (SWI) considers data related to the following categories:
- Behaviour
- Infrastructure
- Condition
- Environment
- Water Quality
- Feeding
- Husbandry
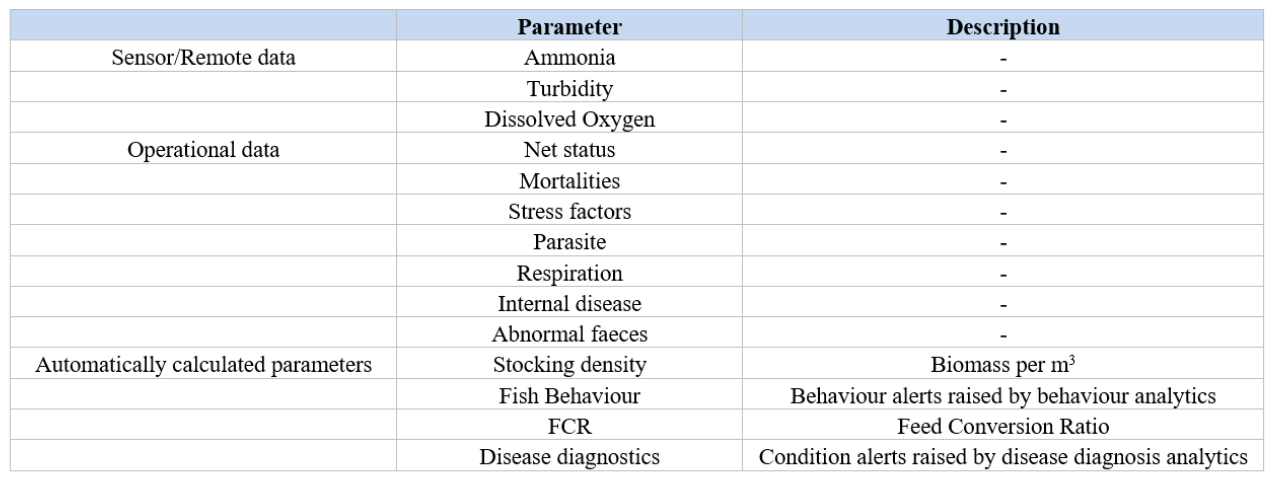
Each piece of information relevant to the stock welfare that is currently collected by the IMS is assigned to one of these categories and given a weight according to its importance. In this way, the IMPAQT Stock Welfare Index (SWI) is calculated as an overall indicator of the site’s status. In addition to the index calculation, a series of messages are also coming as an output from the algorithm, showcasing the overall status of the site. The inputs shown below are considered for these calculations.
Table 1: Stock Welfare – Input parameters